
We’ve had a few users ask how to feed alerts from the HPSS Console into a SIEM. In these cases it was Splunk, so I will show how to quickly get a feed going into Splunk and some basic visualizations. I chose Splunk since that’s what I helped the users with, but any SIEM that will take syslog will work.
The first step is to get the HPSS Console set up to externally log events. This can be enabled by checking the “Enable System Logging” in the preferences window. What happens with the output depends on your OS. On Windows the events are written to Event Log, and on Linux/MacOS they are handled by the syslog daemon. Alternatively you can use the Console plugins system if syslog/eventlog is not flexible enough.
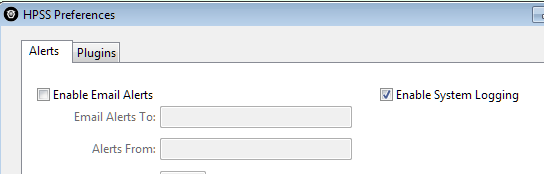
HPSS Preferences Window
Before we go further, we’ll need to configure Splunk to read in the data, or even set up Splunk if you don’t have an existing system. For this blog post, I used the Splunk Docker image to get it up and running a couple minutes in a container.
In Splunk we’ll need to create a “source type”, an “index” and a “data input” to move the data into the index. To create the source type, I put the following definitions in the local props.conf file located in $SPLUNK_HOME/etc/system/local (you may need to create the props.conf file)
[hpss]

EXTRACT-HPSSAgent = Agent: (?P<Honeypoint_Agent>[^ ]+)

EXTRACT-Attacker_IP = from: (?P<Attacker_IP>[^ ]+)

EXTRACT-Port = on port (?P<Port>[^ ]+)

EXTRACT-Alert_Data = Alert Data: (?P<Alert_Data>.+)

TIME_PREFIX = at\s

MAX_TIMESTAMP_LOOKAHEAD = 200

TIME_FORMAT = %Y-%m-%d %H:%M:%S
This tells Splunk how to extract the data from the event. You can also define this in the Splunk web interface by going to Settings -> Source Types and creating a new source type.
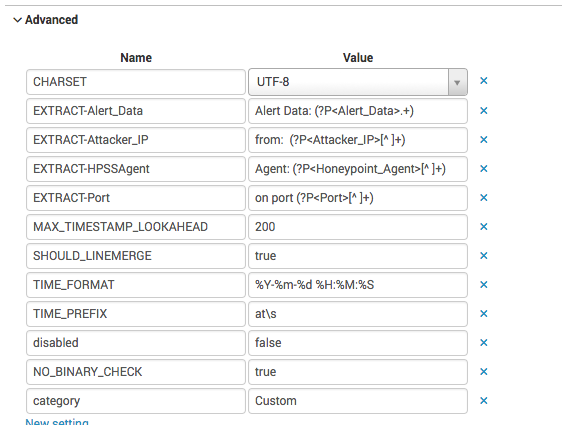
Source Type definition
Next create the Index under Settings -> Indexes. Just giving the index a name and leaving everything default will work fine to get started. 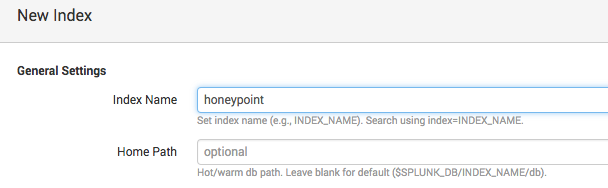
To create a Data Input, go to Settings -> Data Inputs. I’m going to set it up to directly ingest the data through a TCP socket, but if you already have a setup to read files from a centralized logging system, then feel free to use that instead.
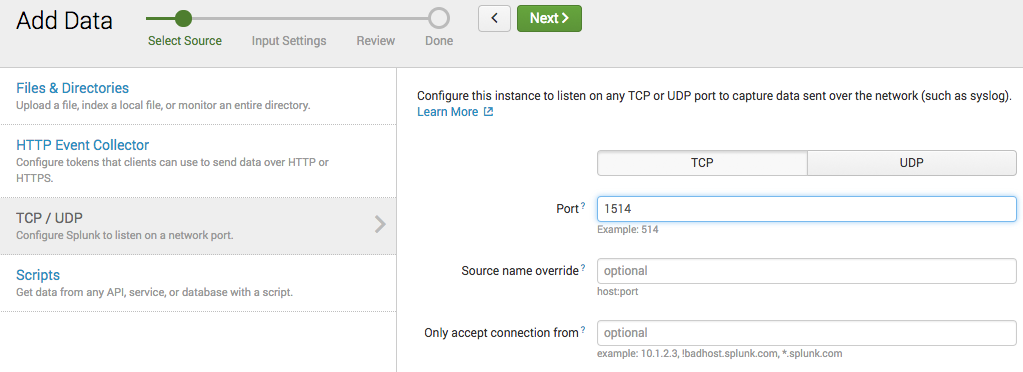 Set the port and protocol to whatever you would like.
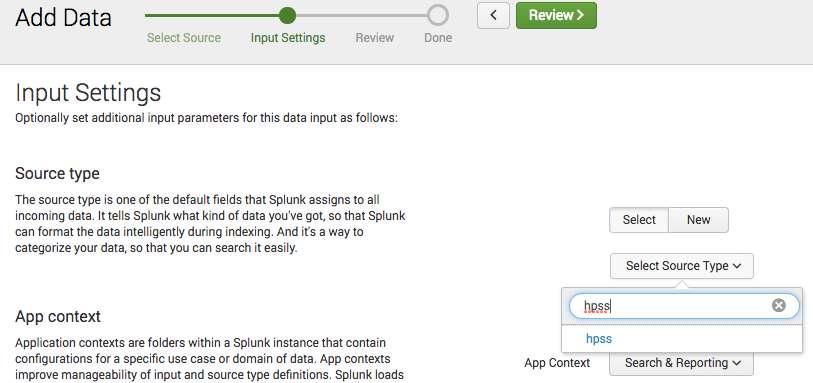
For the source type, manually typing in “hpss” (or whatever you named it) should bring up the already defined source type. Select that, and everything else can remain as is. Then go to review and finish. It’s now ready for you to ship the events to it.
Lastly, we need to get the logs from the Console system to Splunk. Again, this will differ depending on your OS. I will show one way to do this on Windows and one for Linux. However, there are numerous ways to do it. In both cases, replace the IP and Port of your Splunk instance.
On Windows you can use NXLog or another type of eventlog to syslog shipper. After installing NXLog, edit the following into the configuration file.
define ROOT C:\Program Files\nxlog
#define ROOT C:\Program Files (x86)\nxlog
Moduledir %ROOT%\modules
CacheDir %ROOT%\data
Pidfile %ROOT%\data\nxlog.pid
SpoolDir %ROOT%\data
LogFile %ROOT%\data\nxlog.log
<Input in>
Module im_msvistalog
Query <QueryList>\
<Query Id="0">\
<Select Path="HPConsole">*</Select>\
</Query>\
</QueryList>
SavePos TRUE
</Input>
<Output out>
Module om_udp
Host 192.168.232.6
Port 1514
</Output>
<Route 1>
Path in => out
</Route>
On Linux with rsyslog, create a conf file with the following
:msg,contains,"HPSS Agent" @@192.168.232.6:1514
Now Splunk should be receiving any HPSS events sent to it and storing them in the defined index, and extracting the fields during search queries.
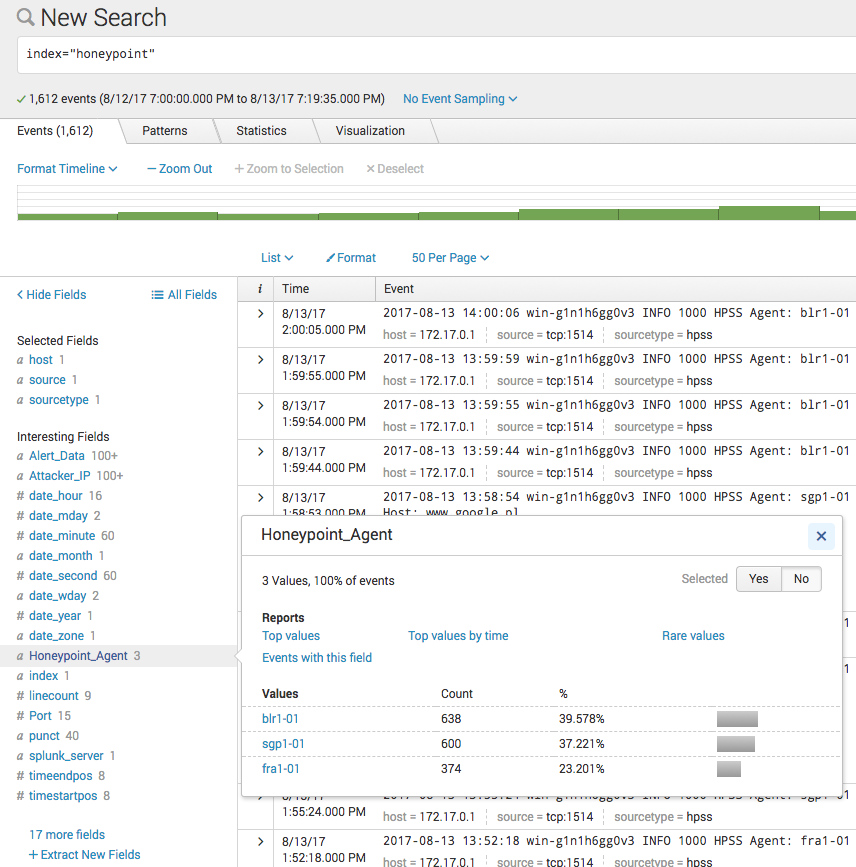
In the future we can look at creating some graphs and analyze the events received. If there is any interest, I can look at creating a Splunk app to configure all of this for you.