Securing AI / Generative AI Use in the Enterprise: Risks, Gaps & Governance

Imagine this: a data science team is evaluating a public generative AI API to help with summarization of documents. One engineer—trying to accelerate prototyping—uploads a dataset containing customer PII (names, addresses, payment tokens) without anonymization. The API ingests that data. Later, another user submits a prompt that triggers portions of the PII to be regurgitated in an output. The leakage reaches customers, regulators, and media.

This scenario is not hypothetical. As enterprise adoption of generative AI accelerates, organizations are discovering that the boundary between internal data and external AI systems is porous—and many have no governance guardrails in place.

VendorRiskAI

According to a recent report, ~89% of enterprise generative AI usage is invisible to IT oversight—that is, it bypasses sanctioned channels entirely. Another survey finds that nearly all large firms deploying AI have seen risk‑related losses tied to flawed outputs, compliance failures, or bias.

The time to move from opportunistic pilots toward robust governance and security is now. In this post I map the risk taxonomy, expose gaps, propose controls and governance models, and sketch a maturity roadmap for enterprises.


Risk Taxonomy

Below I classify major threat vectors for AI / generative AI in enterprise settings.

1. Model Poisoning & Adversarial Inputs

  • Training data poisoning: attackers insert malicious or corrupted data into the training set so that the model learns undesirable associations or backdoors.

  • Backdoor / trigger attacks: a model behaves normally unless a specific trigger pattern (e.g. a token or phrase) is present, which causes malicious behavior.

  • Adversarial inputs at inference time: small perturbations or crafted inputs cause misclassification or manipulation of model outputs.

  • Prompt injection / jailbreaking: an end user crafts prompts to override constraints, extract internal context, or escalate privileges.

2. Training Data Leakage

  • Sensitive training data (proprietary IP, PII, trade secrets) may inadvertently be memorized by large models and revealed via probing.

  • Even with fine‑tuning, embeddings or internal layers might leak associations that can be reverse engineered.

  • Leakage can also occur via model updates, snapshots, or transfer learning pipelines.

3. Inference-Time Output Attacks & Leakage

  • Model outputs might infer relationships (e.g. “given X, the missing data is Y”) that were not explicitly in training but learned implicitly.

  • Large models can combine inputs across multiple queries to reconstruct confidential data.

  • Malicious users can sample outputs exhaustively or probe with adversarial prompts to elicit sensitive data.

4. Misuse & “Shadow AI”

  • Shadow AI: employees use external generative tools outside IT visibility (e.g. via personal ChatGPT accounts) and paste internal documents, violating policy and leaking data.

  • Use of unconstrained AI for high-stakes decisions without validation or oversight.

  • Automation of malicious behaviors (fraud, social engineering) via internal AI capabilities.

5. Compliance, Privacy & Governance Risks

  • Violation of data protection regulations (e.g. GDPR, CCPA) via improper handling or cross‑boundary transfer of PII.

  • In regulated industries (healthcare, finance), AI outputs may inadvertently produce disallowed inferences or violate auditability requirements.

  • Lack of explainability or audit trails makes it hard to prove compliance or investigate incidents.

  • Model decisions may reflect bias, unfairness, or discriminatory patterns that trigger regulatory or reputational liabilities.


Gaps in Existing Solutions

  • Traditional security tooling is blind to AI risks: DLP, EDR, firewall rules do not inspect semantic inference or prompt-based leakage.

  • Lack of visibility into model internals: Most deployed models (especially third‑party or foundation models) are black boxes.

  • Sparse standards & best practices: While frameworks exist (NIST AI RMF, EU AI Act, ISO proposals), concrete guidance for securing generative AI in enterprises is immature.

  • Tooling mismatch: Many AI governance tools are nascent and do not integrate smoothly with existing enterprise security stacks.

  • Team silos: Data science, DevOps, and security often operate in silos. Defects emerge at the intersection.

  • Skill and resource gaps: Few organizations have staff experienced in adversarial ML, formal verification, or privacy-preserving AI.

  • Lifecycle mismatch: AI models require continuous retraining, drift detection, versioning—traditional security is static.


Governance & Defensive Strategies

Below are controls, governance practices, and architectural strategies enterprises should consider.

AI Risk Assessment / Classification Framework

  • Inventorize all AI / ML assets (foundation models, fine‑tuned models, inference APIs).

  • Classify models by risk tier (e.g. low / medium / high) based on sensitivity of inputs/outputs, business criticality, and regulatory impact.

  • Map threat models for each asset: e.g. poisoning, leakage, adversarial use.

  • Integrate this with enterprise risk management (ERM) and vendor risk processes.

Secure Development & DevSecOps for Models

  • Embed adversarial testing, fuzzing, red‑teaming in model training pipelines.

  • Use data validation, anomaly detection, outlier filtering before ingesting training data.

  • Employ version control, model lineage, and reproducibility controls.

  • Build a “model sandbox” environment with strict controls before production rollout.

Access Control, Segmentation & Audit Trails

  • Enforce least privilege access for training data, model parameters, hyperparameters.

  • Use role-based access control (RBAC) and attribute-based access (ABAC) for model execution.

  • Maintain full audit logging of prompts, responses, model invocations, and guardrails.

  • Segment model infrastructure from general infrastructure (use private VPCs, zero trust).

Privacy / Sanitization Techniques

  • Use differential privacy to add noise and limit exposure of individual records.

  • Use secure multiparty computation (SMPC) or homomorphic encryption for sensitive computations.

  • Apply data anonymization / tokenization / masking before use.

  • Use output filtering / content policies to supersede model outputs that might leak or violate policy.

Monitoring, Anomaly Detection & Runtime Guardrails

  • Monitor model outputs for anomalies, drift, suspicious prompting patterns.

  • Use “canary” prompts or test probes to detect model corruption or behavior shifts.

  • Rate-limit or throttle requests to model endpoints.

  • Use AI-defense systems to detect prompt injection or malicious patterns.

  • Flag or block high-risk output paths (e.g. outputs that contain PII, internal config, backdoor triggers).


Operational Integration

Security–Data Science Collaboration

  • Embed security engineers in the AI development lifecycle (shift-left).

  • Educate data scientists in adversarial ML, model risks, privacy constraints.

  • Use cross-functional review boards for high-risk model deployments.

Shadow AI Discovery & Mitigation

  • Monitor outbound traffic or SaaS logins for generative AI usage.

  • Use SaaS monitoring tools or proxy policies to intercept and flag unsanctioned AI use.

  • Deploy internal tools or wrappers for generative AI that inject audit controls.

  • Train employees and publish acceptable use policies for AI usage.

Runtime Controls & Continuous Testing

  • Periodically red-team models (both internal and third-party) to detect vulnerabilities.

  • Revalidate models after each update or retrain.

  • Set up incident response plans specific to AI incidents (model rollback, containment).

  • Conduct regular audits of model behavior, logs, and drift performance.


Case Studies & Real-World Failures & Successes

  • Researchers have found that injecting as few as 250 malicious documents can backdoor a model.

  • Foundation model leakage incidents have been demonstrated in academic research (models regurgitating verbatim input).

  • Organizations like Microsoft Azure, Google Cloud, and OpenAI are starting to offer tools and guardrails (rate limits, privacy options, usage logging) to support enterprise introspection.

  • Some enterprises are mandating all internal AI interactions to flow through a “governed AI proxy” layer to filter or scrub prompts/outputs.


Roadmap / Maturity Model

I propose a phased model:

  1. Awareness & Inventory

    • Catalog AI/ML assets

    • Basic training & policies

    • Executive buy-in

  2. Baseline Controls

    • Access controls, audit logging

    • Data sanitization & DLP for AI pipelines

    • Shadow AI monitoring

  3. Model Protection & Hardening

    • Differential privacy, adversarial testing, prompt filters

    • Runtime anomaly detection

    • Sandbox staging

  4. Audit, Metrics & Continuous Improvement

    • Regular red teaming

    • Drift detection & revalidation

    • Integration into ERM / compliance

    • Internal assurance & audit loops

  5. Advanced Guardrails & Automation

    • Automated policy enforcement

    • Self-healing / rollback mechanisms

    • Formal verification, provable defenses

    • Model explainability & transparency audits


By advancing along this maturity curve, enterprises can evolve from reactive posture to proactive, governed, and resilient AI operations—reducing risk while still reaping the transformative potential of generative technologies.

Need Help or More Information?

Contact MicroSolved and put our deep expertise to work for you in this area. Email us (info@microsolved.com) or give us a call (+1.614.351.1237) for a no-hassle, no-pressure discussion of your needs and our capabilities. We look forward to helping you protect today and predict what is coming next. 


* AI tools were used as a research assistant for this content, but human moderation and writing are also included. The included images are AI-generated.

OT & IT Convergence: Defending the Industrial Attack Surface in 2025

In 2025, the boundary between IT and operational technology (OT) is more porous than ever. What once were siloed environments are now deeply intertwined—creating new opportunities for efficiency, but also a vastly expanded attack surface. For industrial, manufacturing, energy, and critical infrastructure operators, the stakes are high: disruption in OT is real-world damage, not just data loss.

PLC

This article lays out the problem space, dissecting how adversaries move, where visibility fails, and what defense strategies are maturing in this fraught environment.


The Convergence Imperative — and Its Risks

What Is IT/OT Convergence?

IT/OT convergence is the process of integrating information systems (e.g. ERP, MES, analytics, control dashboards) with OT systems (e.g. SCADA, DCS, PLCs, RTUs). The goal: unify data flows, enable predictive maintenance, real-time monitoring, control logic feedback loops, operational analytics, and better asset management.

Yet, as IT and OT merge, their worlds’ assumptions—availability, safety, patch cycles, threat models—collide. OT demands always-on control; IT is optimized for data confidentiality and dynamic architecture. Bridging the two without opening the gates to compromise is the core challenge.

Why 2025 Is Different (and Dangerous)

  • Attacks are physical now. The 2025 Waterfall Threat Report shows a dramatic rise in attacks with physical consequences—shut-downs, equipment damage, lost output. Waterfall Security Solutions

  • Ransomware and state actors converge on OT. OT environments are now a primary target for adversaries aiming for disruption, not just data theft. zeronetworks.com+2Industrial Cyber+2

  • Device proliferation, blind spots. The explosion of IIoT/OT-connected sensors and actuators means incremental exposures mount. Nexus+2IAEE+2

  • Legacy systems with little guardrails. Many OT systems were never built with security in mind; patching is difficult or impossible. SSH+2Industrial Cyber+2

  • Stronger regulation and visibility demands. Critical infrastructure sectors face growing pressure—and liability—for cyber resilience. Honeywell+2Fortinet+2

  • Maturing defenders. Some organizations are already reducing attack frequency through segmentation, threat intelligence, and leadership-driven strategies. Fortinet


Attack Flow: From IT to OT — How the Adversary Moves

Understanding attacker paths is key to defending the convergence.

  1. Initial foothold in IT. Phishing, vulnerabilities, supply chain, remote access are typical vectors.

  2. Lateral movement toward bridging zones. Jump servers, VPNs, misconfigured proxies, flat networks let attackers pivot. Industrial Cyber+2zeronetworks.com+2

  3. Transit through DMZ / industrial demilitarized zones. Poorly controlled conduits allow protocol bridging, data transfer, or command injection. iotsecurityinstitute.com+2Palo Alto Networks+2

  4. Exploit OT protocols and logic. Once in the OT zone, attackers abuse weak or proprietary protocols (Modbus, EtherNet/IP, S7, etc.), manipulate command logic, disable safety interlocks. arXiv+2iotsecurityinstitute.com+2

  5. Physical disruption or sabotage. Alter sensor thresholds, open valves, shut down systems, or destroy equipment.

Because OT environments often have weaker monitoring and fewer detection controls, malicious actions may go unnoticed until damage occurs.


The Visibility & Inventory Gap

You can’t protect what you can’t see.

  • Publicly exposed OT devices number in the tens of thousands globally—many running legacy firmware with known critical vulnerabilities. arXiv

  • Some organizations report only minimal visibility into OT activity within central security operations. Nasstar

  • Legacy or proprietary protocols (e.g. serial, Modbus, nonstandard encodings) resist detection by standard IT tools.

  • Asset inventories are often stale, manual, or incomplete.

  • Patch lifecycle data, firmware versions, configuration drift are poorly tracked in OT systems.

Bridging that visibility gap is a precondition for any robust defense in the converged world.


Architectural Controls: Segmentation, Microperimeters & Zero Trust for OT

You must treat OT not as a static, trusted zone but as a layered, zero-trust-aware domain.

1. Zone & Conduit Model

Apply segmentation by functional zones (process control, supervisory, DMZ, enterprise) and use controlled conduits for traffic. This limits blast radius. iotsecurityinstitute.com+2Palo Alto Networks+2

2. Microperimeters & Microsegmentation

Within a zone, restrict east-west traffic. Only permit communications justified by policy and process. Use software-defined controls or enforcement at gateway devices.

3. Zero Trust Principles for OT

  • Least privilege access: Human, service, and device accounts should only have the rights they need to perform tasks. iotsecurityinstitute.com+1

  • Continuous verification: Authenticate and revalidate sessions, devices, and commands.

  • Context-based access: Enforce access based on time, behavior, process state, operational context.

  • Secure access overlays: Replace jump boxes and VPNs with secure, isolated access conduits that broker access rather than exposing direct paths. Industrial Cyber+1

4. Isolation & Filtering of Protocols

Deep understanding of OT protocols is required to permit or deny specific commands or fields. Use protocol-aware firewalls or DPI (deep packet inspection) for industrial protocols.

5. Redundancy & Fail-Safe Paths

Architect fallback paths and redundancy such that the failure of a security component doesn’t cascade into OT downtime.


Detection & Response in OT Environments

Because OT environments are often low-change, anomaly-based detection is especially valuable.

Anomaly & Behavioral Monitoring

Use models of normal process behavior, network traffic baselines, and device state transitions to detect deviations. This approach catches zero-days and novel attacks that signature tools miss. Nozomi Networks+2zeronetworks.com+2

Protocol-Aware Monitoring

Deep inspection of industrial protocols (Modbus, DNP3, EtherNet/IP, S7) lets you detect invalid or dangerous commands (e.g. disabling PLC logic, spoofing commands).

Hybrid IT/OT SOCs & Playbooks

Forging a unified operations center that spans IT and OT (or tightly coordinates) is vital. Incident playbooks should understand process impact, safe rollback paths, and physical fallback strategies.

Response & Containment

  • Quarantine zones or devices quickly.

  • Use “safe shutdown” logic rather than blunt kill switches.

  • Leverage automated rollback or fail-safe states.

  • Ensure forensic capture of device commands and logs for post-mortem.


Patch, Maintenance & Change in OT Environments

Patching is thorny in OT—disrupting uptime or control logic can have dire consequences. But ignoring vulnerabilities is not viable either.

Risk-Based Patch Prioritization

Prioritize based on:

  1. Criticality of the device (safety, control, reliability).

  2. Exposure (whether reachable from IT or remote networks).

  3. Known exploitability and threat context.

Scheduled Windows & Safe Rollouts

Use maintenance windows, laboratory testing, staged rollouts, and fallback plans to apply patches in controlled fashion.

Virtual Patching / Compensating Controls

Where direct patching is impractical, employ compensating controls—firewall rules, filtering, command-level controls, or wrappers that mediate traffic.

Vendor Coordination & Secure Updates

Work with vendors for safe update mechanisms, integrity verification, rollback capability, and cryptographic signing of firmware.

Configuration Lockdown & Hardening

Disable unused services, remove default accounts, enforce least privilege controls, and lock down configuration interfaces. Industrial Cyber


Operating in Hybrid Environments: Best Practices & Pitfalls

  • Journeys, not Big Bangs. Start with a pilot cell or site; mature gradually.

  • Cross-domain teams. Build integrated IT/OT guardrails teams; train OT engineers with security awareness and IT folk with process sensitivity. iotsecurityinstitute.com+2Secomea+2

  • Change management & governance. Formal processes must span both domains, with risk acceptance, escalation, and rollback capabilities.

  • Security debt awareness. Legacy systems will always exist; plan compensating controls, migration paths, or compensating wrappers.

  • Simulation & digital twins. Use testbeds or digital twins to validate security changes before deployment.

  • Supply chain & third-party access. Strong control over third-party remote access is essential—no direct device access unless brokered and constrained. Industrial Cyber+2zeronetworks.com+2


Governance, Compliance & Regulatory Alignment

  • Map your security controls to frameworks such as ISA/IEC 62443NIST SP 800‑82, and relevant national ICS/OT guidelines. iotsecurityinstitute.com+2Tenable®+2

  • Develop risk governance that includes process safety, availability, and cybersecurity in tandem.

  • Align with critical infrastructure regulation (e.g. NIS2 in Europe, SEC cyber rules, local ICS/OT mandates). Honeywell+1

  • Build executive visibility and metrics (mean time to containment, blast radius, safety impact) to support prioritization.


Roadmap: From Zero → Maturity

Here’s a rough maturation path you might use:

Phase Focus Key Activities
Pilot / Awareness Reduce risk in one zone Map asset inventory, segment pilot cell, deploy detection sensors
Hardening & Control Extend structural defenses Enforce microperimeters, apply least privilege, protocol filtering
Detection & Response Build visibility & control Anomaly detection, OT-aware monitoring, SOC integration
Patching & Maintenance Improve security hygiene Risk-based patching, vendor collaboration, configuration lockdown
Scale & Governance Expand and formalize Extend to all zones, incident playbooks, governance models, metrics, compliance
Continuous Optimization Adapt & refine Threat intelligence feedback, lessons learned, iterative improvements

Start small, show value, then scale incrementally—don’t try to boil the ocean in one leap.


Use Case Scenarios

  1. Remote Maintenance Abuse
    A vendor’s remote access via a jump host is compromised. The attacker uses that jump host to send commands to PLCs via an unfiltered conduit, shutting down a production line.

  2. Logic Tampering via Protocol Abuse
    An attacker intercepts commands over EtherNet/IP and alters setpoints on a pressure sensor—causing shock pressure and damaging equipment before operators notice.

  3. Firmware Exploit on Legacy Device
    A field RTU is running firmware with a known remote vulnerability. The attacker exploits that, gains control, and uses it as a pivot point deeper into OT.

  4. Lateral Movement from IT
    A phishing campaign generates a foothold on IT. The attacker escalates privileges, accesses the central historian, and from there reaches into OT DMZ and onward.

Each scenario highlights the need for segmentation, detection, and disciplined control at each boundary.


Checklist & Practical Guidance

  • ⚙️ Inventory & visibility: Map all OT/IIoT devices, asset data, communications, and protocols.

  • 🔒 Zone & micro‑segment: Enforce strict controls around process, supervisory, and enterprise connectivity.

  • ✅ Least privilege and zero trust: Limit access to the minimal set of rights, revalidate often.

  • 📡 Protocol filtering: Use deep packet inspection to validate or block unsafe commands.

  • 💡 Anomaly detection: Use behavioral models, baselining, and alerts on deviations.

  • 🛠 Patching strategy: Risk-based prioritization, scheduled windows, fallback planning.

  • 🧷 Hardening & configuration control: Remove unused services, lock down interfaces, enforce secure defaults.

  • 🔀 Incident playbooks: Include safe rollback, forensic capture, containment paths.

  • 👥 Cross-functional teams: Co-locate or synchronize OT, IT, security, operations staff.

  • 📈 Metrics & executive reporting: Use security KPIs contextualized to safety, availability, and damage containment.

  • 🔄 Continuous review & iteration: Ingest lessons learned, threat intelligence, and adapt.

  • 📜 Framework alignment: Use ISA/IEC 62443, NIST 800‑82, or sector-specific guidelines.


Final Thoughts

As of 2025, you can’t treat OT as a passive, hidden domain. The convergence is inevitable—and attackers know it. The good news is that mature defense strategies are emerging: segmentation, zero trust, anomaly-based detection, and governance-focused integration.

The path forward is not about plugging every hole at once. It’s about building layered defenses, prioritizing by criticality, and evolving your posture incrementally. In a world where a successful exploit can physically damage infrastructure or disrupt a grid, the resilience you build today may be your strongest asset tomorrow.

More Info and Assistance

For discussion, more information, or assistance, please contact us. (614) 351-1237 will get us on the phone, and info@microsolved.com will get us via email. Reach out to schedule a no-hassle and no-pressure discussion. Put out 30+ years of OT experience to work for you! 


* AI tools were used as a research assistant for this content, but human moderation and writing are also included. The included images are AI-generated.
Cut SOC Noise with an Alert-Quality SLO: A Practical Playbook for Security Teams

Security teams don’t burn out because of “too many threats.” They burn out because of too much junk between them and the real threats: noisy detections, vague alerts, fragile rules, and AI that promises magic but ships mayhem.

SOC

Here’s a simple fix that works in the real world: treat alert quality like a reliability objective. Put noise on a hard budget and enforce a ship/rollback gate—exactly like SRE error budgets. We call it an Alert-Quality SLO (AQ-SLO) and it can reclaim 20–40% of analyst time for higher-value work like hunts, tuning, and purple-team exercises.

The Core Idea: Put a Budget on Junk

Alert-Quality SLO (AQ-SLO): set an explicit ceiling for non-actionable alerts per analyst-hour (NAAH). If a new rule/model/AI feed pushes you over budget, it doesn’t ship—or it auto-rolls back.


Think “error budgets,” but applied to SOC signal quality.


Working definitions (plain language)

  • Non-actionable alert: After triage, it requires no ticket, containment, or tuning request—just closes.
  • Analyst-hour: One hour of human triage time (any level).
  • AQ-SLO: Maximum tolerated non-actionables per analyst-hour over a rolling window.

Baselines and Targets (Start Here)

Before you tune, measure. Collect 2–4 weeks of baselines:

  • Non-actionable rate (NAR) = (Non-actionables / Total alerts) × 100
  • Non-actionables per analyst-hour (NAAH) = Non-actionables / Analyst-hours
  • Mean time to triage (MTTT) = Average minutes to disposition (track P90, too)


Initial SLO targets (adjust to your environment):

  • NAAH ≤ 5.0  (Gold ≤ 3.0, Silver ≤ 5.0, Bronze ≤ 7.0)
  • NAR ≤ 35%    (Gold ≤ 20%, Silver ≤ 35%, Bronze ≤ 45%)
  • MTTT ≤ 6 min (with P90 ≤ 12 min)


These numbers are intentionally pragmatic: tight enough to curb fatigue, loose enough to avoid false heroics.


Ship/Rollback Gate for Rules & AI

Every new detector—rule, correlation, enrichment, or AI model—must prove itself in shadow mode before it’s allowed to page humans.


Shadow-mode acceptance (7 days recommended):

  • NAAH ≤ 3.0, or
  • ≥ 30% precision uplift vs. control, and
  • No regression in P90 MTTT or paging load


Enforcement: If the detector breaches the budget 3 days in 7, auto-disable or revert and capture a short post-mortem. You’re not punishing innovation—you’re defending analyst attention.


Minimum Viable Telemetry (Keep It Simple)

For every alert, capture:

  • detector_id
  • created_at
  • triage_outcome → {actionable | non_actionable}
  • triage_minutes
  • root_cause_tag → {tuning_needed, duplicate, asset_misclass, enrichment_gap, model_hallucination, rule_overlap}


Hourly roll-ups to your dashboard:

  • NAAH, NAR, MTTT (avg & P90)
  • Top 10 noisiest detectors by non-actionable volume and triage cost


This is enough to run the whole AQ-SLO loop without building a data lake first.


Operating Rhythm (SOC-wide, 45 Minutes/Week)

  1. Noise Review (20 min): Examine the Top 10 noisiest detectors → keep, fix, or kill.
  2. Tuning Queue (15 min): Assign PRs/changes for the 3 biggest contributors; set owners and due dates.
  3. Retro (10 min): Are we inside the budget? If not, apply the rollback rule. No exceptions.


Make it boring, repeatable, and visible. Tie it to team KPIs and vendor SLAs.


What to Measure per Detector/Model

  • Precision @ triage = actionable / total
  • NAAH contribution = non-actionables from this detector / analyst-hours
  • Triage cost = Σ triage_minutes
  • Kill-switch score = weighted blend of (precision↓, NAAH↑, triage cost↑)


Rank detectors by kill-switch score to drive your weekly agenda.


Formulas You Can Drop into a Sheet

NAAH = NON_ACTIONABLE_COUNT / ANALYST_HOURS

NAR% = (NON_ACTIONABLE_COUNT / TOTAL_ALERTS) * 100

MTTT = AVERAGE(TRIAGE_MINUTES)

MTTT_P90 = PERCENTILE(TRIAGE_MINUTES, 0.9)

ERROR_BUDGET_USED = max(0, (NAAH – SLO_NAAH) / SLO_NAAH)


These translate cleanly into Grafana, Kibana/ELK, BigQuery, or a simple spreadsheet.


Fast Implementation Plan (14 Days)

Day 1–3: Instrument triage outcomes and minutes in your case system. Add the root-cause tags above.

Day 4–10: Run all changes in shadow mode. Publish hourly NAAH/NAR/MTTT to a single dashboard.

Day 11: Freeze SLOs (start with ≤ 5 NAAH, ≤ 35% NAR).

Day 12–14: Turn on auto-rollback for any detector breaching budget.


If your platform supports feature flags, wrap detectors with a kill-switch. If not, document a manual rollback path and make it muscle memory.


SOC-Wide Incentives (Make It Stick)

  • Team KPI: % of days inside AQ-SLO (target ≥ 90%).
  • Engineering KPI: Time-to-fix for top noisy detectors (target ≤ 5 business days).
  • Vendor/Model SLA: Noise clauses—breach of AQ-SLO triggers fee credits or disablement.


This aligns incentives across analysts, engineers, and vendors—and keeps the pager honest.


Why AQ-SLOs Work (In Practice)

  1. Cuts alert fatigue and stabilizes on-call burdens.
  2. Reclaims 20–40% analyst time for hunts, purple-team work, and real incident response.
  3. Turns AI from hype to reliability: shadow-mode proof + rollback by budget makes “AI in the SOC” shippable.
  4. Improves organizational trust: leadership gets clear, comparable metrics for signal quality and human cost.


Common Pitfalls (and How to Avoid Them)

  • Chasing zero noise. You’ll starve detection coverage. Use realistic SLOs and iterate.
  • No root-cause tags. You can’t fix what you can’t name. Keep the tag set small and enforced.
  • Permissive shadow-mode. If it never ends, it’s not a gate. Time-box it and require uplift.
  • Skipping rollbacks. If you won’t revert noisy changes, your SLO is a wish, not a control.
  • Dashboard sprawl. One panel with NAAH, NAR, MTTT, and the Top 10 noisiest detectors is enough.


Policy Addendum (Drop-In Language You Can Adopt Today)

Alert-Quality SLO: The SOC shall maintain non-actionable alerts ≤ 5 per analyst-hour on a 14-day rolling window. New detectors (rules, models, enrichments) must pass a 7-day shadow-mode trial demonstrating NAAH ≤ 3 or ≥ 30% precision uplift with no P90 MTTT regressions. Detectors that breach the SLO on 3 of 7 days shall be disabled or rolled back pending tuning. Weekly noise-review and tuning queues are mandatory, with owners and due dates tracked in the case system.


Tune the numbers to fit your scale and risk tolerance, but keep the mechanics intact.


What This Looks Like in the SOC

  • An engineer proposes a new AI phishing detector.
  • It runs in shadow mode for 7 days, with precision measured at triage and NAAH tracked hourly.
  • It shows a 36% precision uplift vs. the current phishing rule set and no MTTT regression.
  • It ships behind a feature flag tied to the AQ-SLO budget.
  • Three days later, a vendor feed change spikes duplicate alerts. The budget breaches.
  • The feature flag kills the noisy path automatically, a ticket captures the post-mortem, and the tuning PR lands in 48 hours.
  • Analyst pager load stays stable; hunts continue on schedule.


That’s what operationalized AI looks like when noise is a first-class reliability concern.


Want Help Standing This Up?

MicroSolved has implemented AQ-SLOs and ship/rollback gates in SOCs of all sizes—from credit unions to automotive suppliers—across SIEMs, EDR/XDR, and AI-assisted detection stacks. We can help you:

  • Baseline your current noise profile (NAAH/NAR/MTTT)
  • Design your shadow-mode trials and acceptance gates
  • Build the dashboard and auto-rollback workflow
  • Align SLAs, KPIs, and vendor contracts to AQ-SLOs
  • Train your team to run the weekly operating rhythm


Get in touch: Visit microsolved.com/contact or email info@microsolved.com to talk with our team about piloting AQ-SLOs in your environment.


* AI tools were used as a research assistant for this content, but human moderation and writing are also included. The included images are AI-generated.

The Zero Trust Scorecard: Tracking Culture, Compliance & KPIs

The Plateau: A CISO’s Zero Trust Dilemma

I met with a CISO last month who was stuck halfway up the Zero Trust mountain. Their team had invested in microsegmentation, MFA was everywhere, and cloud entitlements were tightened to the bone. Yet, adoption was stalling. Phishing clicks still happened. Developers were bypassing controls to “get things done.” And the board wanted proof their multi-million-dollar program was working.

This is the Zero Trust Plateau. Many organizations hit it. Deploying technologies is only the first leg of the journey. Sustaining Zero Trust requires cultural change, ongoing measurement, and the ability to course-correct quickly. Otherwise, you end up with a static architecture instead of a dynamic security posture.

This is where the Zero Trust Scorecard comes in.

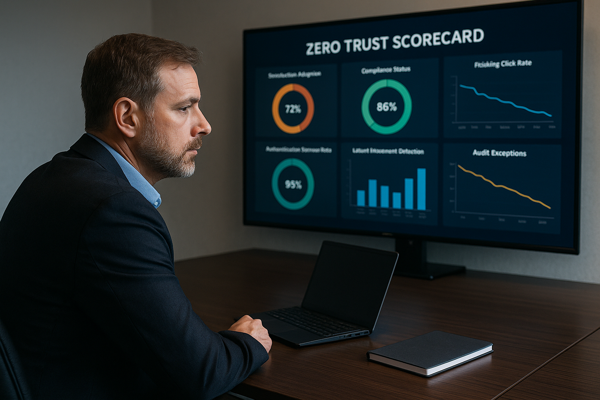
ZeroTrustScorecard


Why Metrics Change the Game

Zero Trust isn’t a product. It’s a philosophy—and like any philosophy, its success depends on how people internalize and practice it over time. The challenge is that most organizations treat Zero Trust as a deployment project, not a continuous process.

Here’s what usually happens:

  • Post-deployment neglect – Once tools are live, metrics vanish. Nobody tracks if users adopt new patterns or if controls are working as intended.

  • Cultural resistance – Teams find workarounds. Admins disable controls in dev environments. Business units complain that “security is slowing us down.”

  • Invisible drift – Cloud configurations mutate. Entitlements creep back in. Suddenly, your Zero Trust posture isn’t so zero anymore.

This isn’t about buying more dashboards. It’s about designing a feedback loop that measures technical effectiveness, cultural adoption, and compliance drift—so you can see where to tune and improve. That’s the promise of the Scorecard.


The Zero Trust Scorecard Framework

A good Zero Trust Scorecard balances three domains:

  1. Cultural KPIs

  2. Technical KPIs

  3. Compliance KPIs

Let’s break them down.


🧠 Cultural KPIs: Measuring Adoption and Resistance

  • Stakeholder Adoption Rates
    Track how quickly and completely different business units adopt Zero Trust practices. For example:

    • % of developers using secure APIs instead of legacy connections.

    • % of employees logging in via SSO/MFA.

  • Training Completion & Engagement
    Zero Trust requires a mindset shift. Measure:

    • Security training completion rates (mandatory and voluntary).

    • Behavioral change: number of reported phishing emails per user.

  • Phishing Resistance
    Run regular phishing simulations. Watch for:

    • % of users clicking on simulated phishing emails.

    • Time to report suspicious messages.

Culture is the leading indicator. If people aren’t on board, your tech KPIs won’t matter for long.


⚙️ Technical KPIs: Verifying Your Architecture Works

  • Authentication Success Rates
    Monitor login success/failure patterns:

    • Are MFA denials increasing because of misconfiguration?

    • Are users attempting legacy protocols (e.g., NTLM, basic auth)?

  • Lateral Movement Detection
    Test whether microsegmentation and identity controls block lateral movement:

    • % of simulated attacker movement attempts blocked.

    • Number of policy violations detected in network flows.

  • Device Posture Compliance
    Check device health before granting access:

    • % of devices meeting patching and configuration baselines.

    • Remediation times for out-of-compliance devices.

These KPIs help answer: “Are our controls operating as designed?”


📜 Compliance KPIs: Staying Aligned and Audit-Ready

  • Audit Pass Rates
    Track the % of internal and external audits passed without exceptions.

  • Cloud Posture Drift
    Use tools like CSPM (Cloud Security Posture Management) to measure:

    • Number of critical misconfigurations over time.

    • Mean time to remediate drift.

  • Policy Exception Requests
    Monitor requests for policy exceptions. A high rate could signal usability issues or cultural resistance.

Compliance metrics keep regulators and leadership confident that Zero Trust isn’t just a slogan.


Building Your Zero Trust Scorecard

So how do you actually build and operationalize this?


🎯 1. Define Goals and Data Sources

Start with clear objectives for each domain:

  • Cultural: “Reduce phishing click rate by 50% in 6 months.”

  • Technical: “Block 90% of lateral movement attempts in purple team exercises.”

  • Compliance: “Achieve zero critical cloud misconfigurations within 90 days.”

Identify data sources: SIEM, identity providers (Okta, Azure AD), endpoint managers (Intune, JAMF), and security awareness platforms.


📊 2. Set Up Dashboards with Examples

Create dashboards that are consumable by non-technical audiences:

  • For executives: High-level trends—“Are we moving in the right direction?”

  • For security teams: Granular data—failed authentications, policy violations, device compliance.

Example Dashboard Widgets:

  • % of devices compliant with Zero Trust posture.

  • Phishing click rates by department.

  • Audit exceptions over time.

Visuals matter. Use red/yellow/green indicators to show where attention is needed.


📅 3. Establish Cadence and Communication

A Scorecard is useless if nobody sees it. Embed it into your organizational rhythm:

  • Weekly: Security team reviews technical KPIs.

  • Monthly: Present Scorecard to business unit leads.

  • Quarterly: Share executive summary with the board.

Use these touchpoints to celebrate wins, address resistance, and prioritize remediation.


Why It Works

Zero Trust isn’t static. Threats evolve, and so do people. The Scorecard gives you a living view of your Zero Trust program—cultural, technical, and compliance health in one place.

It keeps you from becoming the CISO stuck halfway up the mountain.

Because in Zero Trust, there’s no summit. Only the climb.

Questions and Getting Help

Want to discuss ways to progress and overcome the plateau? Need help with planning, building, managing, or monitoring Zero Trust environments? 

Just reach out to MicroSolved for a no-hassle, no-pressure discussion of your needs and our capabilities. 

Phone: +1.614.351.1237 or Email: info@microsolved.com


* AI tools were used as a research assistant for this content, but human moderation and writing are also included. The included images are AI-generated.

Evolving the Front Lines: A Modern Blueprint for API Threat Detection and Response

As APIs now power over half of global internet traffic, they have become prime real estate for cyberattacks. While their agility and integration potential fuel innovation, they also multiply exposure points for malicious actors. It’s no surprise that API abuse ranks high in the OWASP threat landscape. Yet, in many environments, API security remains immature, fragmented, or overly reactive. Drawing from the latest research and implementation playbooks, this post explores a comprehensive and modernized approach to API threat detection and response, rooted in pragmatic security engineering and continuous evolution.

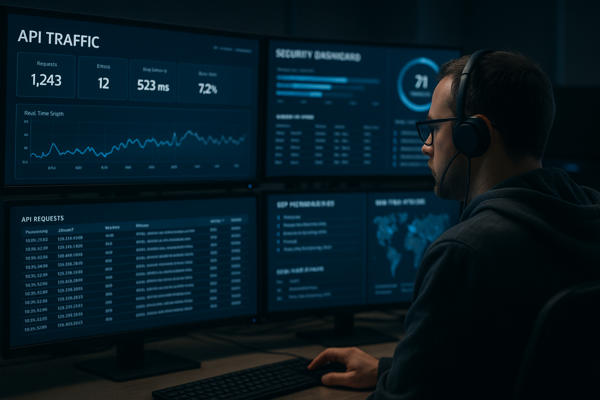
APIMonitoring

 The Blind Spots We Keep Missing

Even among security-mature organizations, API environments often suffer from critical blind spots:

  •  Shadow APIs – These are endpoints deployed outside formal pipelines, such as by development teams working on rapid prototypes or internal tools. They escape traditional discovery mechanisms and logging, leaving attackers with forgotten doors to exploit. In one real-world breach, an old version of an authentication API exposed sensitive user details because it wasn’t removed after a system upgrade.
  •  No Continuous Discovery – As DevOps speeds up release cycles, static API inventories quickly become obsolete. Without tools that automatically discover new or modified endpoints, organizations can’t monitor what they don’t know exists.
  •  Lack of Behavioral Analysis – Many organizations still rely on traditional signature-based detection, which misses sophisticated threats like “low and slow” enumeration attacks. These involve attackers making small, seemingly benign requests over long periods to map the API’s structure.
  •  Token Reuse & Abuse – Tokens used across multiple devices or geographic regions can indicate session hijacking or replay attacks. Without logging and correlating token usage, these patterns remain invisible.
  •  Rate Limit Workarounds – Attackers often use distributed networks or timed intervals to fly under static rate-limiting thresholds. API scraping bots, for example, simulate human interaction rates to avoid detection.

 Defenders: You’re Sitting on Untapped Gold

For many defenders, SIEM and XDR platforms are underutilized in the API realm. Yet these platforms offer enormous untapped potential:

  •  Cross-Surface Correlation – An authentication anomaly in API traffic could correlate with malware detection on a related endpoint. For instance, failed logins followed by a token request and an unusual download from a user’s laptop might reveal a compromised account used for exfiltration.
  •  Token Lifecycle Analytics – By tracking token issuance, usage frequency, IP variance, and expiry patterns, defenders can identify misuse, such as tokens repeatedly used seconds before expiration or from IPs in different countries.
  •  Behavioral Baselines – A typical user might access the API twice daily from the same IP. When that pattern changes—say, 100 requests from 5 IPs overnight—it’s a strong anomaly signal.
  •  Anomaly-Driven Alerting – Instead of relying only on known indicators of compromise, defenders can leverage behavioral models to identify new threats. A sudden surge in API calls at 3 AM may not break thresholds but should trigger alerts when contextualized.

 Build the Foundation Before You Scale

Start simple, but start smart:

1. Inventory Everything – Use API gateways, WAF logs, and network taps to discover both documented and shadow APIs. Automate this discovery to keep pace with change.
2. Log the Essentials – Capture detailed logs including timestamps, methods, endpoints, source IPs, tokens, user agents, and status codes. Ensure these are parsed and structured for analytics.
3. Integrate with SIEM/XDR – Normalize API logs into your central platforms. Begin with the API gateway, then extend to application and infrastructure levels.

Then evolve:

 Deploy rule-based detections for common attack patterns like:

  •  Failed Logins: 10+ 401s from a single IP within 5 minutes.
  •  Enumeration: 50+ 404s or unique endpoint requests from one source.
  •  Token Sharing: Same token used by multiple user agents or IPs.
  •  Rate Abuse: More than 100 requests per minute by a non-service account.

 Enrich logs with context—geo-IP mapping, threat intel indicators, user identity data—to reduce false positives and prioritize incidents.

 Add anomaly detection tools that learn normal patterns and alert on deviations, such as late-night admin access or unusual API method usage.

 The Automation Opportunity

API defense demands speed. Automation isn’t a luxury—it’s survival:

  •  Rate Limiting Enforcement that adapts dynamically. For example, if a new user triggers excessive token refreshes in a short window, their limit can be temporarily reduced without affecting other users.
  •  Token Revocation that is triggered when a token is seen accessing multiple endpoints from different countries within a short timeframe.
  •  Alert Enrichment & Routing that generates incident tickets with user context, session data, and recent activity timelines automatically appended.
  •  IP Blocking or Throttling activated instantly when behaviors match known scraping or SSRF patterns, such as access to internal metadata IPs.

And in the near future, we’ll see predictive detection, where machine learning models identify suspicious behavior even before it crosses thresholds, enabling preemptive mitigation actions.

When an incident hits, a mature API response process looks like this:

  1.  Detection – Alerts trigger via correlation rules (e.g., multiple failed logins followed by a success) or anomaly engines flagging strange behavior (e.g., sudden geographic shift).
  2.  Containment – Block malicious IPs, disable compromised tokens, throttle affected endpoints, and engage emergency rate limits. Example: If a developer token is hijacked and starts mass-exporting data, it can be instantly revoked while the associated endpoints are rate-limited.
  3.  Investigation – Correlate API logs with endpoint and network data. Identify the initial compromise vector, such as an exposed endpoint or insecure token handling in a mobile app.
  4.  Recovery – Patch vulnerabilities, rotate secrets, and revalidate service integrity. Validate logs and backups for signs of tampering.
  5.  Post-Mortem – Review gaps, update detection rules, run simulations based on attack patterns, and refine playbooks. For example, create a new rule to flag token use from IPs with past abuse history.

 Metrics That Matter

You can’t improve what you don’t measure. Monitor these key metrics:

  •  Authentication Failure Rate – Surges can highlight brute force attempts or credential stuffing.
  •  Rate Limit Violations – How often thresholds are exceeded can point to scraping or misconfigured clients.
  •  Mean Time to Detect (MTTD) and Mean Time to Respond (MTTR) – Benchmark how quickly threats are identified and mitigated.
  •  Token Misuse Frequency – Number of sessions showing token reuse anomalies.
  •  API Detection Rule Coverage – Track how many OWASP API Top 10 threats are actively monitored.
  •  False Positive Rate – High rates may degrade trust and response quality.
  •  Availability During Incidents – Measure uptime impact of security responses.
  •  Rule Tuning Post-Incident – How often detection logic is improved following incidents.

 Final Word: The Threat is Evolving—So Must We

The state of API security is rapidly shifting. Attackers aren’t waiting. Neither can we. By investing in foundational visibility, behavioral intelligence, and response automation, organizations can reclaim the upper hand.

It’s not just about plugging holes—it’s about anticipating them. With the right strategy, tools, and mindset, defenders can stay ahead of the curve and turn their API infrastructure from a liability into a defensive asset.

Let this be your call to action.

More Info and Assistance by Leveraging MicroSolved’s Expertise

Call us (+1.614.351.1237) or drop us a line (info@microsolved.com) for a no-hassle discussion of these best practices, implementation or optimization help, or an assessment of your current capabilities. We look forward to putting our decades of experience to work for you!  


* AI tools were used as a research assistant for this content, but human moderation and writing are also included. The included images are AI-generated.

Enhancing Security Operations with AI-Driven Log Analysis: A Path to Cooperative Intelligence

Introduction

Managing log data efficiently has become both a necessity and a challenge.
Log data, ranging from network traffic and access records to application errors, is essential to cybersecurity operations,
yet the sheer volume and complexity can easily overwhelm even the most seasoned analysts. AI-driven log analysis promises
to lighten this burden by automating initial data reviews and detecting anomalies. But beyond automation, an ideal AI
solution should foster a partnership with analysts, supporting and enhancing their intuitive insights.

AILogAnalyst

Building a “Chat with Logs” Interface: Driving Curiosity and Insight

At the heart of a successful AI-driven log analysis system is a conversational interface—one that enables analysts to “chat” with logs. Imagine a system where, rather than parsing raw data streams line-by-line, analysts can investigate logs in a natural, back-and-forth manner. A key part of this chat experience should be its ability to prompt curiosity.

The AI could leverage insights from past successful interactions to generate prompts that align with common threat indicators.
For instance, if previous analysts identified a spike in failed access attempts as a red flag for brute force attacks, the AI
might proactively ask, “Would you like to investigate this cluster of failed access attempts around 2 AM?” Prompts like these,
rooted in past experiences and threat models, can draw analysts into deeper investigation and support intuitive, curiosity-driven workflows.

Prioritizing Log Types and Formats

The diversity of log formats presents both an opportunity and a challenge for AI. Logs from network traffic, access logs,
application errors, or systems events come in various formats—often JSON, XML, or text—which the AI must interpret and standardize.
An effective AI-driven system should accommodate all these formats, ensuring no data source is overlooked.

For each type, AI can be trained to recognize particular indicators of interest. Access logs, for example, might reveal unusual
login patterns, while network traffic logs could indicate unusual volumes or connection sources. This broad compatibility ensures
that analysts receive a comprehensive view of potential threats across the organization.

A Cooperative Model for AI and Analyst Collaboration

While AI excels at rapidly processing vast amounts of log data, it cannot entirely replace the human element in security analysis.
Security professionals bring domain expertise, pattern recognition, and, perhaps most importantly, intuition. A cooperative model, where AI and analysts work side-by-side, allows for a powerful synergy: the AI can scan for anomalies and flag potential issues, while the analyst applies their knowledge to contextualize findings.

The interface should support this interaction through a feedback loop. Analysts can provide real-time feedback to the AI, indicating false positives or requesting deeper analysis on particular flags. A chat-based interface, in this case, enhances fluidity in interaction. Analysts could ask questions like, “What other systems did this IP address connect to recently?” or “Show me login patterns for this account over the past month.” This cooperative, conversational approach can make the AI feel less like a tool and more like a partner.

Privacy Considerations for Sensitive Logs

Log data often contains sensitive information, making data privacy a top priority. While on-device, local AI models offer strong protection,
many organizations may find private instances of cloud-based models secure enough for all but the most sensitive data, like classified logs or those under nation-state scrutiny.

In these cases, private cloud instances provide robust scalability and processing power without exposing data to external servers. By incorporating
strict data access controls, encryption, and compliance with regulatory standards, such instances can strike a balance between performance and security.
For highly sensitive logs, on-premises or isolated deployments ensure data remains under complete control. Additionally, conducting regular AI model
audits can help verify data privacy standards and ensure no sensitive information leaks during model training or updates.

Conclusion: Moving Toward Cooperative Intelligence

AI-driven log analysis is transforming the landscape of security operations, offering a path to enhanced efficiency and effectiveness. By providing
analysts with a conversational interface, fostering curiosity, and allowing for human-AI cooperation, organizations can create a truly intelligent log
analysis ecosystem. This approach doesn’t replace analysts but empowers them, blending AI’s speed and scale with human intuition and expertise.

For organizations aiming to achieve this synergy, the focus should be on integrating AI as a collaborative partner. Through feedback-driven interfaces,
adaptable privacy measures, and a structured approach to anomaly detection, the next generation of log analysis can combine the best of both human and
machine intelligence, setting a new standard in security operations.

More Information:

While this is a thought exercise, now is the time to start thinking about applying some of these techniques. For more information or to have a discussion about strategies and tactics, please contact MicroSolved at info@microsolved.com. Thanks, and we look forward to speaking with you!


* AI tools were used as a research assistant for this content.


How to Craft Effective Prompts for Threat Detection and Log Analysis


Introduction

As cybersecurity professionals, log analysis is one of our most powerful tools in the fight against threats. By sifting through the vast troves of data generated by our systems, we can uncover the telltale signs of malicious activity. But with so much information to process, where do we even begin?

The key is to arm ourselves with well-crafted prompts that guide our investigations and help us zero in on the threats that matter most. In this post, we’ll explore three sample prompts you can use to supercharge your threat detection and log analysis efforts. So grab your magnifying glass, and let’s dive in!

Prompt 1: Detecting Unusual Login Activity

One common indicator of potential compromise is unusual login activity. Attackers frequently attempt to brute force their way into accounts or use stolen credentials. To spot this, try a prompt like:

Show me all failed login attempts from IP addresses that have not previously authenticated successfully to this system within the past 30 days. Include the source IP, account name, and timestamp.

This will bubble up login attempts coming from new and unfamiliar locations, which could represent an attacker trying to gain a foothold. You can further refine this by looking for excessive failed attempts to a single account or many failed attempts across numerous accounts from the same IP.

Prompt 2: Identifying Suspicious Process Execution

Attackers will often attempt to run malicious tools or scripts after compromising a system. You can find evidence of this by analyzing process execution logs with a prompt such as:

Show me all processes launched from temporary directories or user profile AppData directories. Include the process name, associated username, full command line, and timestamp.

Legitimate programs rarely run from these locations, so this can quickly spotlight suspicious activity. Pay special attention to scripting engines like PowerShell or command line utilities like PsExec being launched from unusual paths. Examine the full command line to understand what the process was attempting to do.

Prompt 3: Spotting Anomalous Network Traffic

Compromised systems frequently communicate with external command and control (C2) servers to receive instructions or exfiltrate data. To detect this, try running the following prompt against network connection logs:

Show me all outbound network connections to IP addresses outside of our organization’s controlled address space. Exclude known good IPs like software update servers. Include source and destination IPs, destination port, connection duration, and total bytes transferred.

Look for long-duration connections or large data transfers to previously unseen IP addresses, especially on non-standard ports. Correlating this with the associated process can help determine if the traffic is malicious or benign.

Conclusion

Effective prompts like these are the key to unlocking the full potential of your log data for threat detection. You can quickly identify the needle in the haystack by thoughtfully constructing queries that target common attack behaviors.

But this is just the beginning. As you dig into your findings, let each answer guide you to the next question. Pivot from one data point to the next to paint a complete picture and scope the full extent of any potential compromise.

Mastering the art of prompt crafting takes practice, but the effort pays dividends. Over time, you’ll develop a robust library of questions that can be reused and adapted to fit evolving needs. So stay curious, keep honing your skills, and happy hunting!

More Help?

Ready to take your threat detection and log analysis skills to the next level? The experts at MicroSolved are here to help. With decades of experience on the front lines of cybersecurity, we can work with you to develop custom prompts tailored to your unique environment and risk profile. We’ll also show you how to integrate these prompts into a comprehensive threat-hunting program that proactively identifies and mitigates risks before they impact your business. Be sure to start asking the right questions before an attack succeeds. Contact us today at info@microsolved.com to schedule a consultation and build your defenses for tomorrow’s threats.


* AI tools were used as a research assistant for this content.


Optimizing DNS and URL Request Logging


Organizations aiming to enhance their cybersecurity posture should consider optimizing their processes around DNS and URL request logging and review. This task is crucial for identifying, mitigating, and preventing cyber threats in an increasingly interconnected digital landscape. Here’s a practical guide to help organizations streamline these processes effectively.

 1. Establish Clear Logging Policies
Define what data should be collected from DNS and URL requests. Policies should address the scope of logging, retention periods, and privacy considerations, ensuring compliance with relevant laws and regulations like GDPR.

 2. Leverage Automated Tools for Data Collection
Utilize advanced logging tools that automate the collection of DNS and URL request data. These tools should not only capture the requests but also the responses, timestamps, and the initiating device’s identity. Integration with existing cybersecurity tools can enhance visibility and threat detection capabilities.

 3. Implement Real-time Monitoring and Alerts
Set up real-time monitoring systems to analyze DNS and URL request logs for unusual patterns or malicious activities. Automated alerts can expedite the response to potential threats, minimizing the risk of significant damage.

 4. Conduct Regular Audits and Reviews
Schedule periodic audits of your DNS and URL logging processes to ensure they comply with your established policies and adapt to evolving cyber threats. Audits can help identify gaps in your logging strategy and areas for improvement.

 5. Prioritize Data Analysis and Threat Intelligence
Invest in analytics platforms that can process large volumes of log data to identify trends, anomalies, and potential threats. Incorporating threat intelligence feeds into your analysis can provide context to the data, enhancing the detection of sophisticated cyber threats.

 6. Enhance Team Skills and Awareness
Ensure that your cybersecurity team has the necessary skills to manage and analyze DNS and URL logs effectively. Regular training sessions can keep the team updated on the latest threat landscapes and analysis techniques.

 7. Foster Collaboration with External Partners
Collaborate with ISPs, cybersecurity organizations, and industry groups to share insights and intelligence on emerging threats. This cooperation can lead to a better understanding of the threat environment and more effective mitigation strategies.

 8. Streamline Incident Response with Integrated Logs
Integrate DNS and URL log analysis into your incident response plan. Quick access to relevant log data during a security incident can speed up the investigation and containment efforts, reducing the impact on your organization.

 9. Review and Adapt to Technological Advances
Continuously evaluate new logging technologies and methodologies to ensure your organization’s approach remains effective. The digital landscape and associated threats are constantly evolving, requiring adaptive logging strategies.

 10. Document and Share Best Practices
Create comprehensive documentation of your DNS and URL logging and review processes. Sharing best practices and lessons learned with peers can contribute to a stronger cybersecurity community.

By optimizing DNS and URL request logging and review processes, organizations can significantly enhance their ability to detect, investigate, and respond to cyber threats. A proactive and strategic approach to logging can be a cornerstone of a robust cybersecurity defense strategy.


* AI tools were used in the research and creation of this content.

What to Look For in a DHCP Log Security Audit

Examining the DHCP logs

In today’s ever-evolving technology landscape, information security professionals face numerous challenges in ensuring the integrity and security of network infrastructures. As servers and devices communicate within networks, one crucial element to consider is DHCP (Dynamic Host Configuration Protocol) logs. These logs provide valuable insights into network activity, aiding in identifying security issues and potential threats. Examining DHCP logs through a thorough security audit is a critical step that can help organizations pinpoint vulnerabilities and effectively mitigate risks.

Why are DHCP Logs Important?

DHCP servers are central in assigning IP addresses and managing network resources. By constantly logging activities, DHCP servers enable administrators to track device connections, detect unauthorized access attempts, and identify abnormal network behavior. Consequently, DHCP logs clarify network utilization, application performance, and potential security incidents, making them a vital resource for information security professionals.

What Security Issues Can Be Identified in DHCP Logs?

When analyzing DHCP logs, security professionals should look for several key indicators of potential security concerns. These may include IP address conflicts, unauthorized IP address allocations, rogue DHCP servers, and abnormal DHCP server configurations. Additionally, DHCP logs can help uncover DoS (Denial of Service) attacks, attempts to bypass network access controls, and instances of network reconnaissance in some circumstances.

In conclusion, conducting a comprehensive security audit of DHCP logs is an essential practice for information security professionals. By leveraging the data contained within these logs, organizations can identify and respond to potential threats, ensuring the overall security and stability of their network infrastructure. Stay tuned for our upcoming blog posts, where we will delve deeper into the crucial aspects of DHCP log analysis and its role in fortifying network defenses.

Parsing the List of Events Logged

When conducting a DHCP log security audit, information security professionals must effectively parse the list of events logged to extract valuable insights and identify potential security issues.

To parse the logs and turn them into easily examined data, obtain the log files from the DHCP server. These log files are typically stored in a default logging path specified in the server parameters. Once acquired, the logs can be examined using various tools, including the server management console or event log viewer.

Begin by analyzing the log entries for critical events such as IP address conflicts, unauthorized IP address allocations, and abnormal DHCP server configurations. Look for any indications of rogue DHCP servers, as they can pose a significant security risk.

Furthermore, pay close attention to entries related to network reconnaissance, attempts to bypass network access controls and DoS attacks. These events can potentially reveal targeted attacks or malicious activities within the network.

By effectively parsing the list of events logged, information security professionals can uncover potential security issues, identify malicious activities, and take necessary measures to mitigate risks and protect the network infrastructure. It is crucial to remain vigilant and regularly conduct DHCP log audits to ensure the ongoing security of the network.

Heuristics that Represent Malicious Behaviors

When conducting a DHCP log security audit, information security professionals should look for specific heuristics representing potentially malicious behaviors. These heuristics can help identify security issues and prevent potential threats. It’s essential to understand what these heuristics mean and how to investigate them further.

Some examples of potentially malicious DHCP log events include:

1. Multiple DHCP Server Responses: This occurs when multiple devices on the network respond to DHCP requests, indicating the presence of rogue DHCP servers. Investigate the IP addresses associated with these responses to identify the unauthorized server and mitigate the security risk.

2. IP Address Pool Exhaustion: This event indicates that all available IP addresses in a subnet have been allocated or exhausted. It could suggest an unauthorized device or an unexpected influx of devices on the network. Investigate the cause and take appropriate actions to address the issue.

3. Unusual DHCP Lease Durations: DHCP lease durations outside the normal range can be suspicious. Short lease durations may indicate an attacker attempting to maintain control over an IP address. Long lease durations could suggest an attempt to evade IP address tracking. Investigate these events to identify any potential malicious activities.

Summary

A DHCP log security audit is crucial for information security professionals to detect and mitigate potential threats within their network. By analyzing DHCP log events, security teams can uncover malicious activities and take appropriate actions to protect their systems.

In this audit, several DHCP log events should be closely examined. One such event is multiple DHCP server responses, indicating the presence of rogue DHCP servers. Investigating the IP addresses associated with these responses can help identify unauthorized servers and address the security risk.

Another event that requires attention is IP address pool exhaustion. This event suggests the allocation of all available IP addresses in a subnet or an unexpected increase in devices on the network. Identifying the cause of this occurrence is vital to mitigate any potential security threats.

Unusual DHCP lease durations are also worth investigating. Short lease durations may suggest an attacker’s attempt to maintain control over an IP address, while long lease durations could indicate an effort to evade IP address tracking.

By conducting a thorough DHCP log security audit, security teams can proactively protect their networks from unauthorized devices, rogue servers, and potential malicious activities. Monitoring and analyzing DHCP log events should be an essential part of any organization’s overall security strategy.

* Just to let you know, we used some AI tools to gather the information for this article, and we polished it up with Grammarly to make sure it reads just right!

FAQ on Audit Log Best Practices

Q: What are audit logs?

A: Audit logs are records of all events and security-related information that occur within a system. This information is crucial for incident response, threat detection, and compliance monitoring.

Q: Why is audit log management important?

A: Audit log management is essential for every organization that wants to ensure its data security. Without audit logs, organizations would have no way of knowing who accessed what information when or how the incident happened or whether unauthorized users or suspicious activity occurred. Moreover, audit log management supports compliance with industry regulations and guidelines.

Q: What are the best practices for audit log management?

A: To ensure that your audit log management practices meet the CIS CSC version 8 guidelines and safeguard requirements, consider implementing the following best practices:

1. Define the audit log requirements based on industry regulations, guidelines, and best practices.

2. Establish audit policies and procedures that align with your organization’s requirements and implement them consistently across all systems and devices.
3. Secure audit logs by collecting, storing, and protecting them securely to prevent unauthorized access or tampering.
4. Monitor and review audit logs regularly for anomalies, suspicious activity, and security violations, such as unauthorized access attempts, changes to access rights, and software installations.
5. Configure audit logging settings to generate records of critical security controls, including attempts to gain unauthorized access or make unauthorized changes to the network.
6. Generate alerts in real-time for critical events, including security violations, unauthorized access attempts, changes to access rights, and software installations.
7. Regularly test audit log management controls to ensure their effectiveness and meet your organization’s audit log requirements.

Q: What are the benefits of following audit log management best practices?

A: Following audit log management best practices can establish a strong framework for incident response, threat detection, and compliance monitoring. This, in turn, can help safeguard against unauthorized access, malicious activity, and other security breaches, prevent legal and financial penalties, and maintain trust levels with clients and partners.

Q: How long should audit logs be kept?

A: As a general rule, storage of audit logs should include 90 days hot (meaning actively available for immediate review or alerting), 6 months warm (meaning they can be restored within hours), and two years cold (meaning they can be restored within days). However, organizations should define retention periods based on their audit log requirements and compliance regulations. [1] [2]

*This article was written with the help of AI tools and Grammarly.